Binary Exploitation 101 - Buffer Overflow
This blog series is still a work in progress. The content may change without notice.
In this chapter, we’ll learn how function calls work and buffer overflow. The materials for this chapter can be found in the chapter_03 folder.
Introduction
The provided materials include a C program called chal.c. (Only the main function is shown below.) The final goal of this chapter is to exploit this program using Buffer Overflow and achieve arbitrary command execution. Can you spot where the vulnerabilities are? (There are at least two.)
1
2
3
4
5
6
7
8
9
10
11
12
13
14
int main(void) {
    char buf[0x20];

    dump_stack();

    printf("Input: ");
    gets(buf);
    printf("Output: ");
    printf(buf);
    putchar('\n');

    dump_stack();
    return 0;
}
The main function first calls dump_stack to print the stack, then uses gets to read user input into the local variable buf. It then prints the input using printf, calls dump_stack again, and exits.
When we run this program, we’ll see something like this:
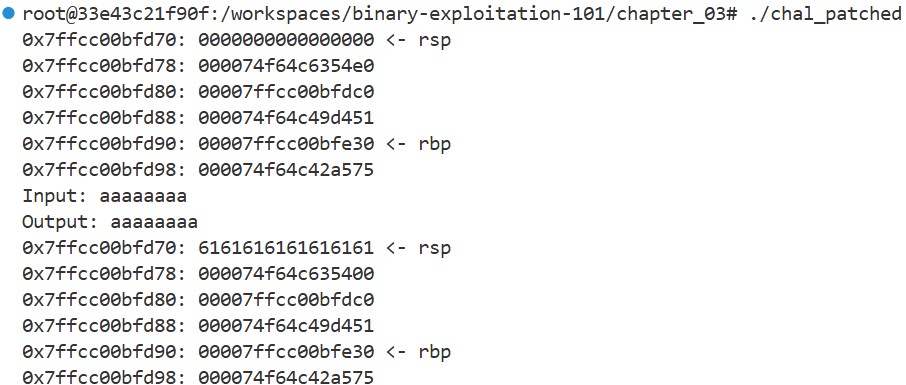
The ASCII Code for ‘a’ is 0x61. As we can see, the input string is copied into the stack buffer buf, and the program echoes it back exactly as expected. But remember how buf was defined:
1
char buf[0x20];
The buffer size is 0x20, So what happens if we input more than 0x20 bytes? Let’s try:
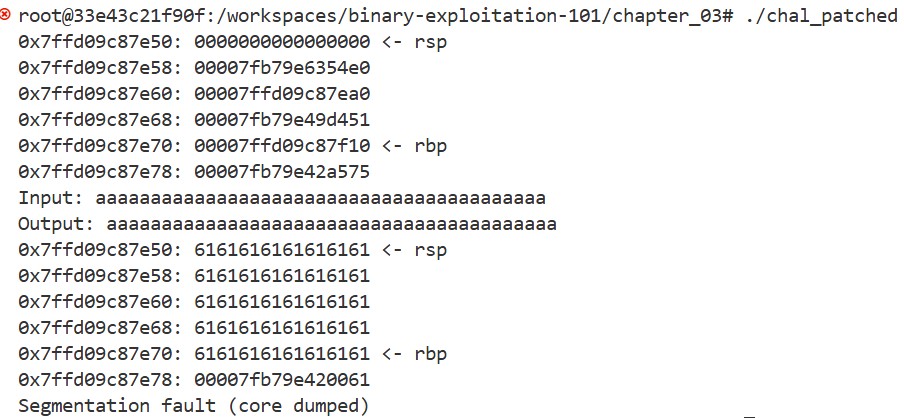
Wow! The program crashes. From the result, it’s clear that inputs longer than 0x20 bytes are copied into the stack. It’s because gets function does not check the size of the input (to be precise, it keeps reading until it encounters a ‘\n’). This is our first vulnerability. Now, the question is: can we take advantage of this vulnerability to do something interesting? To figure that out, we first need to understand how function calls work.
How Function Calls Work
Let’s learn how function calls work using the following program as an example. The main function calls the sum function, which calculates the sum of seven arguments:
1
2
3
4
5
6
7
int sum(int arg0, int arg1, int arg2, int arg3, int arg4, int arg5, int arg6) {
    return arg0 + arg1 + arg2 + arg3 + arg4 + arg5 + arg6;
}

int main(void) {
    return sum(0, 1, 2, 3 ,4 ,5, 6);
}
We can start pwndbg with the following command. This sets a breakpoint at the main function using b main and then runs the program with r:
1
pwndbg -q --ex 'b main' --ex 'r' ./function_call
Next, by running disass, we can see the machine code of the main function. The call instruction is the machine-level instruction that performs a function call:
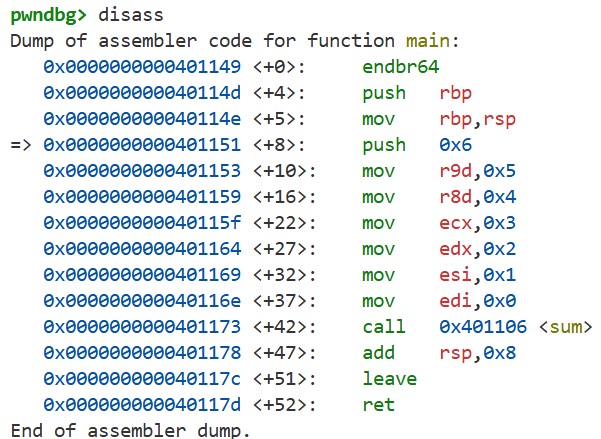
Set a breakpoint on the call instruction using b *0x40116b and continue execution with c. Then, use i r and x/2xg $rsp to see the registers and the stack, respectively:
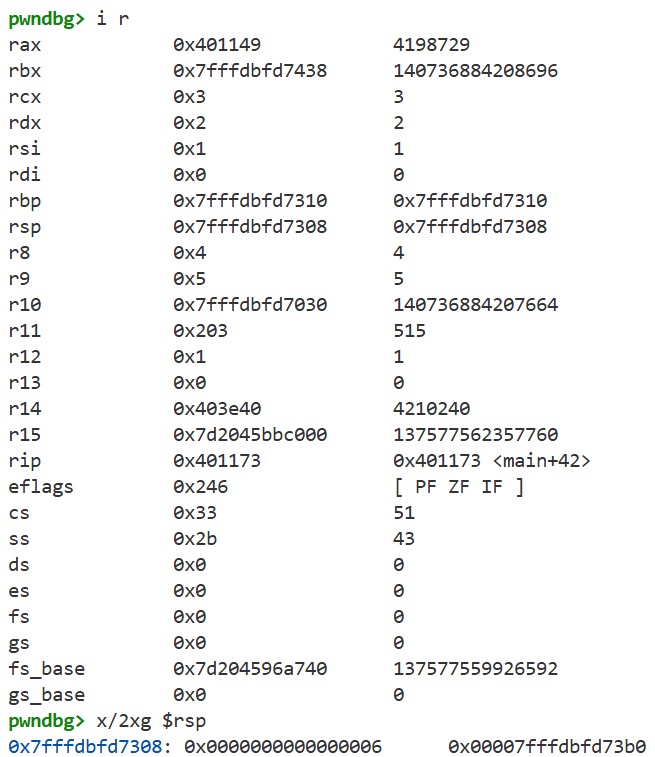
Compare these results with the program above. We can see that the arguments 0, 1, 2, 3, 4, 5, and 6 passed to the sum function are stored as follows: the first six arguments (0–5) are stored in the registers rdi, rsi, rdx, rcx, r8, and r9, respectively, while the last argument (6) is stored on the stack. This is because, as we saw in Chapter 2, our program follows the System V ABI. The ABI (Application Binary Interface) specifies how function arguments are passed. For more details, see section 3.2.3 “Parameter Passing” in the spec.
Now that we understand how the arguments are passed, let’s use si to execute the call instruction and enter the sum function. If we run x/2xg $rsp again, we can see the stack has changed:

A new value, 0x401170, has been pushed onto the stack. What exactly is this value? We’ll find out later, when the sum function returns upon executing the ret instruction.
By running disass, we can see the machine code of the sum function:
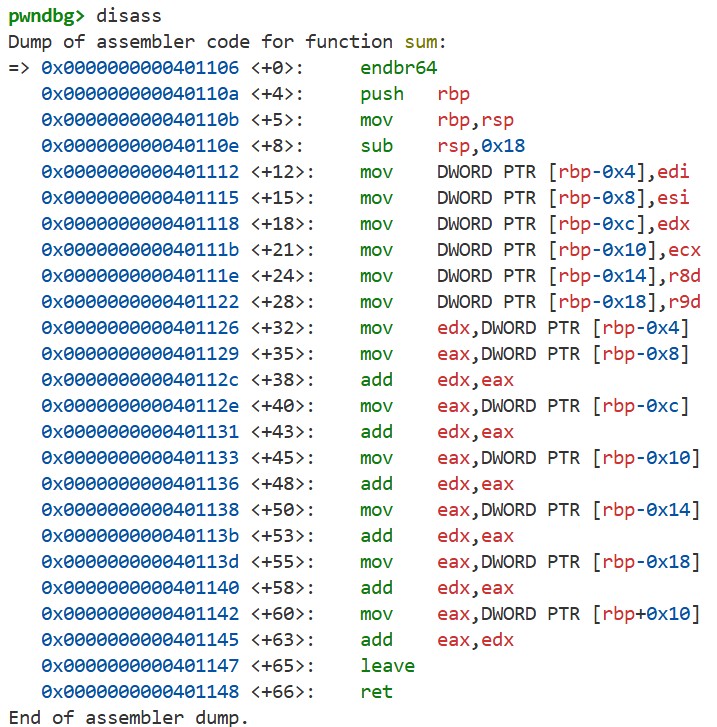
At the beginning of the function, the arguments are copied onto the stack. By considering the correspondence between each register and the arguments, we can see where arg0–arg6 are located on the stack.
Local variables at runtime are not accessed by name; instead, they are accessed via offsets from rbp. The reason for using rbp instead of rsp is that rsp can change dynamically during stack operations within the function. If variables were accessed via rsp, the compiler would need to adjust the offsets according to these changes. By using rbp, the compiler can access variables with fixed offsets, making code generation simpler.
Notice that at the beginning and end of the main and sum functions, there is the following machine code:
1
2
3
4
push   rbp
mov    rbp,rsp
...
leave
This saves rbp and restores rbp and rsp. At the start of the function, rbp is pushed onto the stack, and its value is updated to the current rsp. The leave instruction performs the opposite operation—that is, mov rsp, rbp; pop rbp. This restores the original rbp and resets rsp to its value before the function was called.
Additionally, in the sum function, we see the following machine code:
1
2
3
push   rbp
mov    rbp,rsp
sub    rsp,0x18
This allocates the stack frame for the function. The local variables of the function are stored in this stack frame. In fact, the offsets of arg0–arg5 we looked at earlier are all within 0x18. This explains why arg0–arg6 are called “local” variables. As explained before, the leave instruction restores the values of rbp and rsp, so the stack frame of the sum function exists only “locally” during its execution.
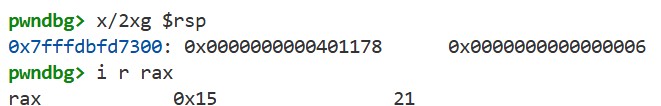
Next, let’s trace the process of returning from the sum function. Set a breakpoint on the ret instruction using b *0x401144 and continue execution with c. Then, run x/2xg $rsp to see the stack. we can see that the value pushed during the earlier call instruction is now at the top of the stack. Also, by running i r rax, we can see that the rax register holds the value 21, which is the sum of arg0–arg6. According to the System V ABI, the return value of a function is stored in the rax register:
Finally, use si to execute the ret instruction. If we run x/2xg $rsp again, we can see that the stack has changed, and checking rip with i r rip shows that the value from the stack has been loaded into the rip register:
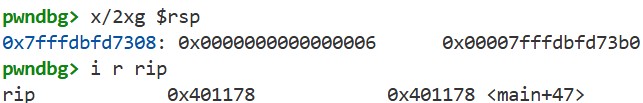
This means that the value pushed onto the stack during the call instruction was the return address. On x86-64, the call instruction pushes the return address onto the stack, and the ret instruction pops it to return to the caller. This is how function calls work.
Buffer Overflow
As we saw in the How Function Calls Work section, when the call instruction is executed, the return address is pushed onto the stack, and eventually, the ret instruction transfers control back to that address.
Then what if we could overwrite this return address? This is the core idea behind buffer overflow. As we saw in the Introduction, giving the program input larger than 0x20 bytes caused it to crash. This happened because the return address was overwritten by the input, and the ret instruction transferred control to an invalid address.
Then, what if we overwrite it with a valid address instead? Recall that chal.c defines the following win function:
1
2
3
4
void win(void) {
    char *argv[] = {"/bin/sh", NULL};
    execve(argv[0], argv, NULL);
}
As I will explain in detail in the next chapter, the win function launches a shell, so if we can overwrite the return address with its address, we can launch a shell even though the win function is never explicitly called in the program!
Exercise
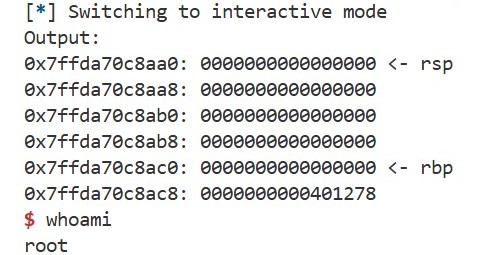
Based on what you have learned so far, write an exploit that launches a shell using buffer overflow. You can use the template, and the following hints may help. For how to use pwntools, refer to the documentation. If successful, you should be able to launch a shell like this:
If you have any questions, feel free to leave a comment below. You can see my solution here.
Hints
- You can find the address of the
winfunction using thereadelfcommand:1
readelf -s ./chal_patched | grep win
- The offset between
bufand the return address can be calculated from the output of thedump_stackfunction or by inspecting it in GDB.
How to Debug your Exploit
If you want to debug your exploit, the gdb.debug function is useful. First, modify your code as follows:
1
2
#conn = process([chal.path])
conn = gdb.debug([chal.path], gdbscript)
Next, run the tmux command:
1
tmux
Finally, run your exploit using the following command. GDB will start, allowing you to debug your code. You can adjust gdbscript in the template program as needed:
1
python3 exploit.py