Binary Exploitation 101 - Hello World
This blog series is still a work in progress. The content may change without notice.
In this chapter, we’ll learn how a C program is converted into an executable file, the structure of ELF, memory segments, and the basics of using a debugger through a Hello World program. The materials for this chapter can be found in the chapter_02 folder.
Hello World
In this chapter, we’ll use the following Hello World program as an example:
1
2
3
4
int main(void) {
    printf("Hello World\n");
    return 0;
}
We can build this program using the gcc command. Here, we specify -g to enable debug information, -no-pie to disable PIE (Position-Independent Executable), and -fcf-protection=none to disable Intel CET (Control-flow Enforcement Technology):
1
gcc -g -no-pie -o hello_world -fcf-protection=none hello_world.c
As a result, a file named hello_world is created. Executing it will print “Hello World”.
It looks very simple, right? But even with just this small program, a lot of things are actually happening behind the scenes.
How a C Program Becomes an Executable
What actually happens behind the scenes when we pass hello_world.c to the gcc command?
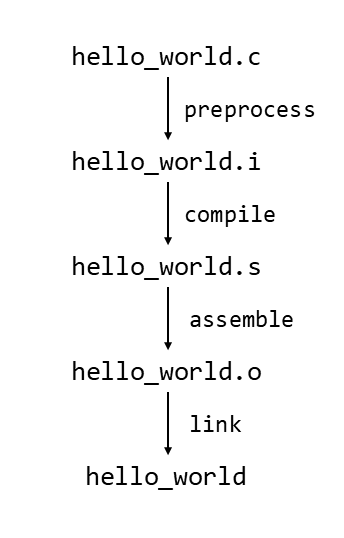
In general, a program written in C goes through the following steps to become an executable:
- Preprocess – Expands header files and replaces macros.
- Compile – Converts the C program into assembly code.
- Assemble – Converts the assembly code into machine code.
- Link – Combines the necessary object files to create the executable.
The programs that perform each of these steps are called the preprocessor, compiler, assembler, and linker, respectively. The gcc command executes these programs in order to generate hello_world from hello_world.c.
Let’s see this in action. By specifying -save-temps, we can generate the intermediate files:
1
gcc -g -no-pie -o hello_world -fcf-protection=none -masm=intel --save-temps hello_world.c
As a result, the following intermediate files are created:
hello_world.i– Result of step 1hello_world.s– Result of step 2hello_world.o– Result of step 3
I won’t go into the details of each file here, but readers who are interested can inspect them to understand exactly what happens at each step. The following diagram summarizes the flow of how a C program becomes an executable file:
ELF
What kind of file is hello_world? Let’s check it using the file command:
1
file ./hello_world
The result shows that this file is in the ELF (Executable and Linkable Format). ELF is a file format widely used on Linux. An ELF file consists of three types of headers: the ELF header, section header, and program header, and consists of multiple sections and segments. The section header and program header store information about the sections and segments, respectively.
Below is a conceptual diagram of the ELF structure. In the diagram, dashed boxes represent sections, and solid boxes represent segments:
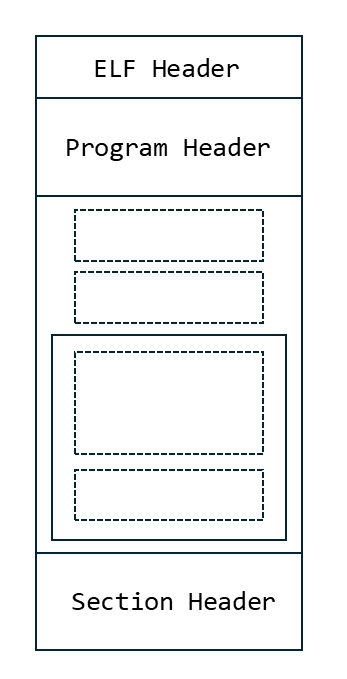
Sections are logical units referenced by the compiler and linker, while segments are logical units referenced by the loader. From the diagram, We can see that some sections are included in segments, while others are not.
ELF Header
Let’s examine the ELF header of hello_world using the readelf command:
1
readelf -h ./hello_world
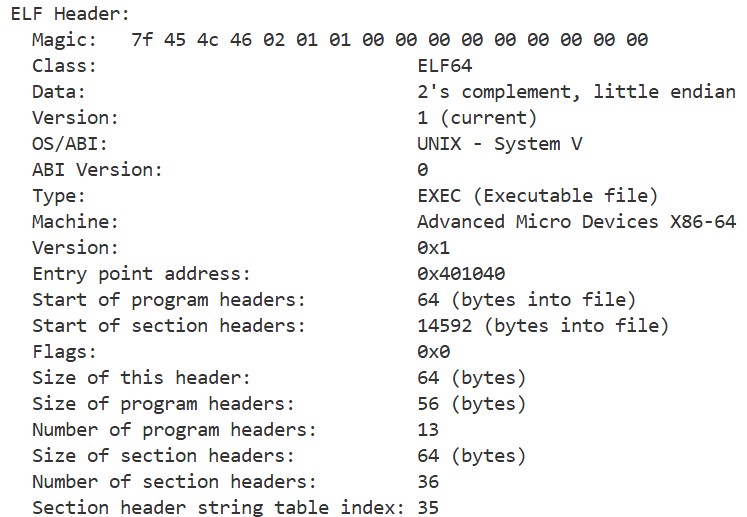
We can see that it contains information about the architecture, ABI (Application Binary Interface), the program’s entry point, and the offsets of the section and program header.
Section Header
Next, let’s examine the section header of hello_world:
1
readelf -S ./hello_world
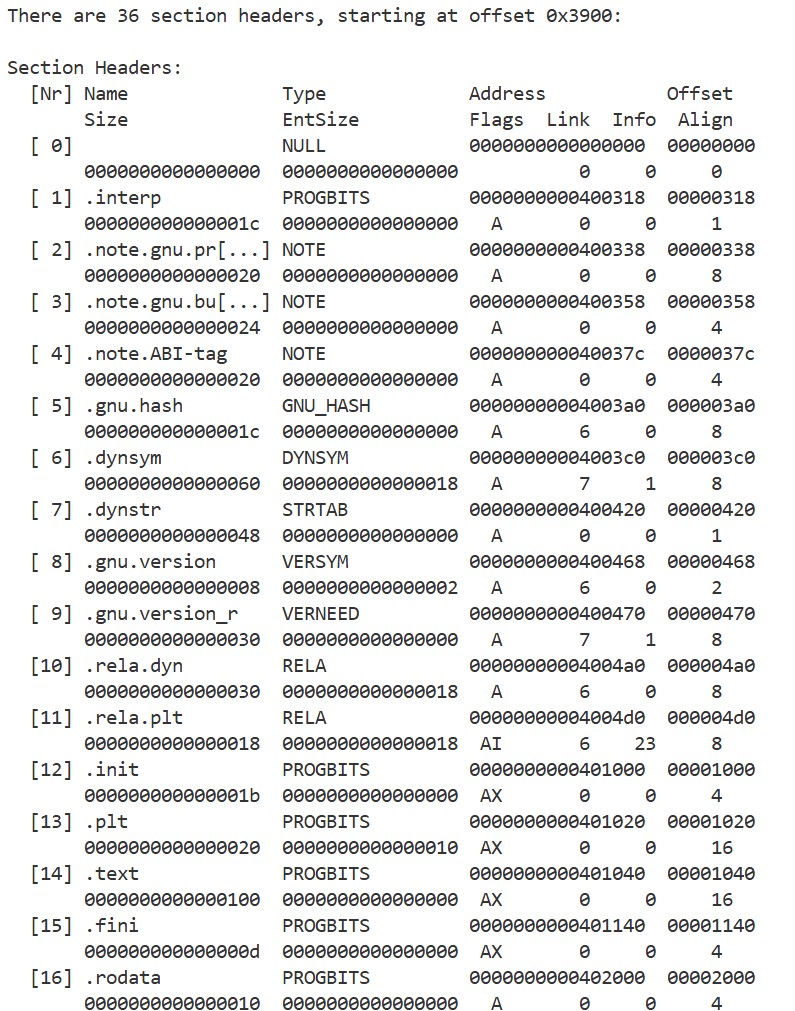
We can see that there are various sections such as .dynsym, .dynstr, .plt, .text, and .rodata (the image shows only part of the output).
Program Header
Finally, let’s examine the program header of hello_world:
1
readelf -l ./hello_world
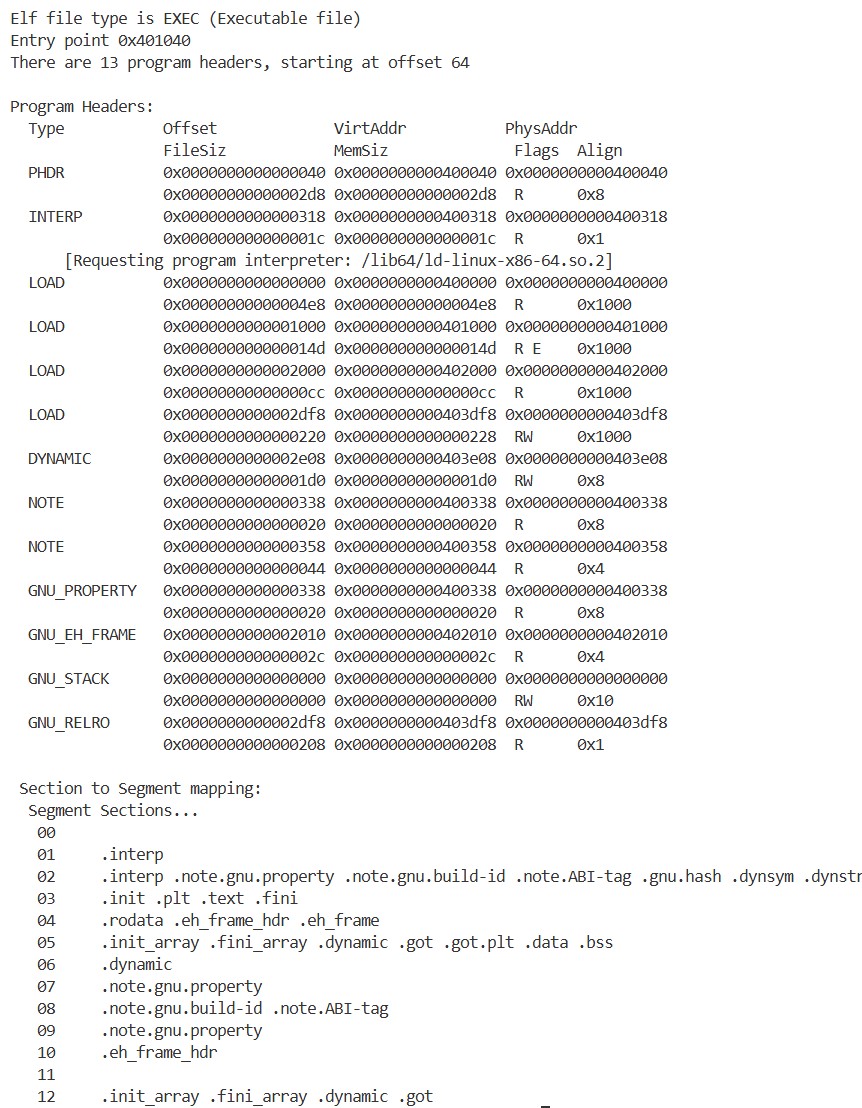
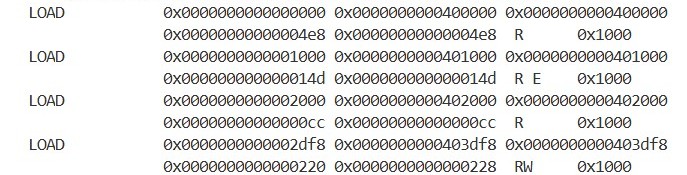
We can see that there are different types of segments, such as LOAD and DYNAMIC, and that multiple sections are grouped together as a single segment. For example, the third LOAD segment (0-indexed) contains the .plt and .text sections. As the name suggests, the .text section contains the program’s code. Therefore, the flags for this segment are R and E, allowing it to be read and executed. Based on VirtAddr and MemSiz, we can see that this segment is loaded in the range 0x401000 to 0x40114d. As we checked earlier, the program’s entry point is 0x401040, which falls within this segment.
Loader and Memory Segment
It is the loader’s role to execute hello_world. In Linux, the loader is implemented inside the kernel, and the load_elf_binary function loads an ELF file into memory:
1
2
3
4
5
6
7
8
9
10
11
12
13
14
15
16
static int load_elf_binary(struct linux_binprm *bprm)
{
    ...
    for(i = 0, elf_ppnt = elf_phdata;
        i < elf_ex->e_phnum; i++, elf_ppnt++) {
        ...
        if (elf_ppnt->p_type != PT_LOAD)
            continue;
        ...

        error = elf_load(bprm->file, load_bias + vaddr, elf_ppnt,
                elf_prot, elf_flags, total_size);
        ...
    }
    ...
}
The loader loads the program into memory according to the information in the LOAD segments we saw in the Program Header section, and eventually jumps to its entry point.
Debugging with pwndbg
Finally, let’s trace the execution of hello_world using a debugger. We can start pwndbg with the following command. Here, we set a breakpoint at the entry point we saw in the Program Header section using b *0x401040, and run the program with r:
1
pwndbg -q --ex 'b *0x401040' --ex 'r' ./hello_world
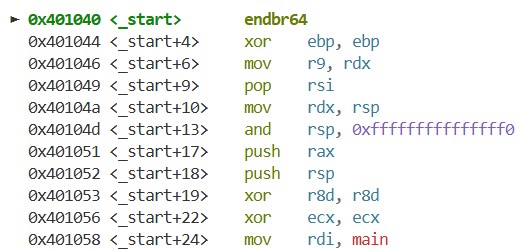
As a result, execution stops at the _start function. The entry point of a C program is not the main function!:
By using the vmmap command, we can view the memory map of this process:
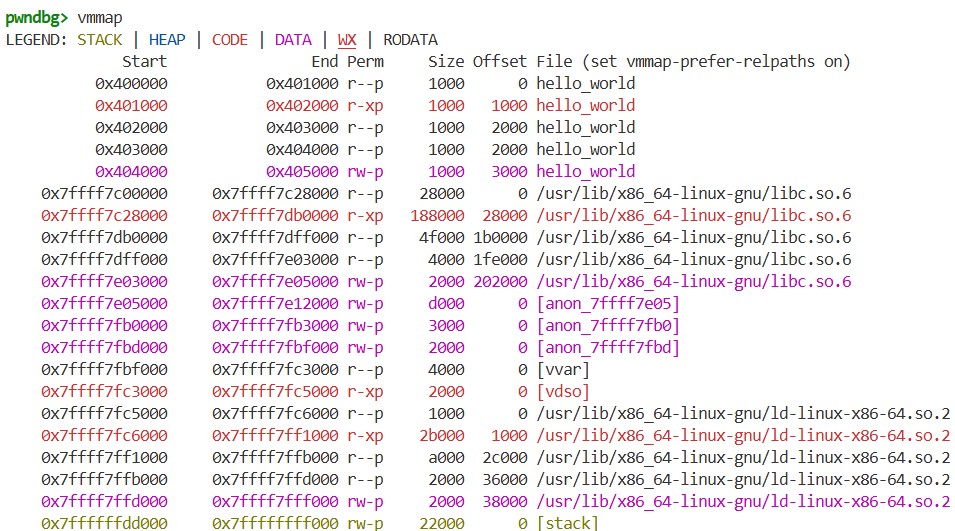
From the results, we can see that, in addition to hello_world, shared libraries such as libc.so.6 and the dynamic linker ld-linux-x86-64.so.2 are loaded, and areas like the stack and vdso also exist. If we compare the part of the output corresponding to hello_world with the LOAD segments we examined in the Program Header section, we can see that the virtual addresses and permissions match:
Next, we set a breakpoint at the main function using b main and continue execution with c. Then, by using disass, we can view the x86-64 machine code. This is the machine code of the main function:
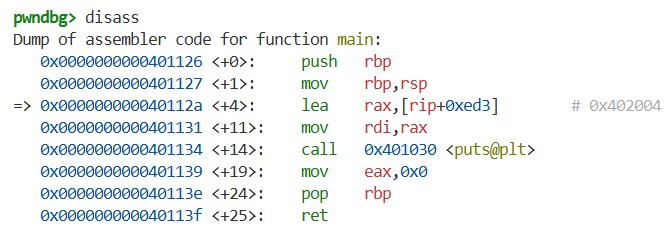
If we compare this with hello_world.s, which we generated in the How a C Program Becomes an Executable section, we can see that they match:
1
2
3
4
5
6
7
8
9
10
11
12
13
14
15
16
17
18
19
20
21
main:
.LFB0:
	.file 1 "hello_world.c"
	.loc 1 4 16
	.cfi_startproc
	push	rbp
	.cfi_def_cfa_offset 16
	.cfi_offset 6, -16
	mov	rbp, rsp
	.cfi_def_cfa_register 6
	.loc 1 5 5
	lea	rax, .LC0[rip]
	mov	rdi, rax
	call	puts@PLT
	.loc 1 6 12
	mov	eax, 0
	.loc 1 7 1
	pop	rbp
	.cfi_def_cfa 7, 8
	ret
	.cfi_endproc
By using the i r command, we can view the CPU registers:
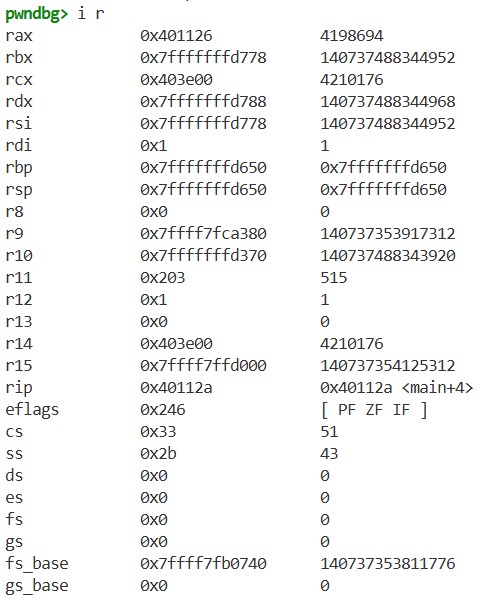
The rip register is the program counter, holding the address of the next instruction to execute. The rsp register is the stack pointer, holding the address of the top of the stack. We can confirm this from the previous vmmap and disass command outputs.
If we execute the program one step using the si command, and then use disass and i r again, we get the following results:
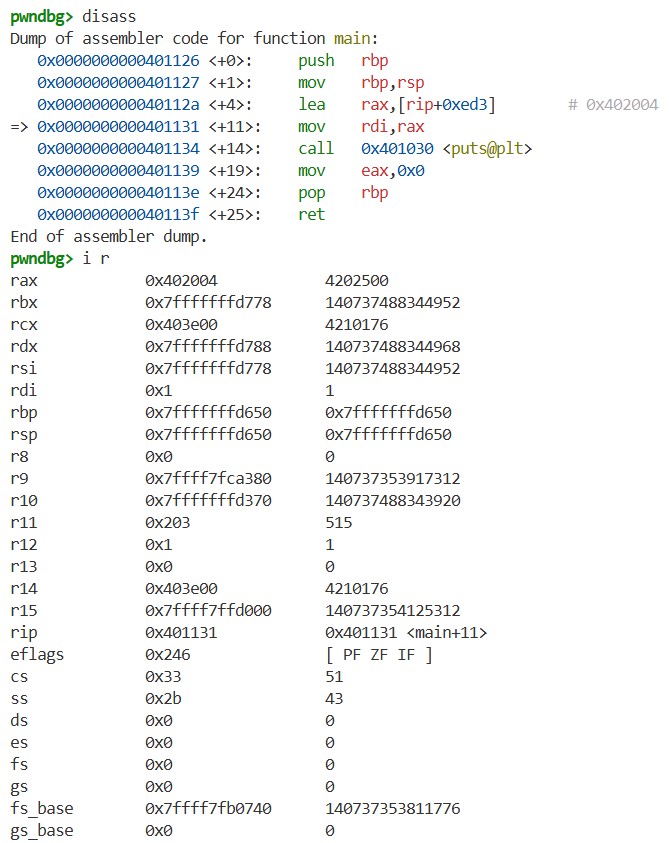
We can see that executing the lea instruction changes the value in the rax register and updates rip to the address of the next instruction. This is exactly what the CPU does when executing a program: it updates rip, executes instructions, and reads and writes registers and memory while executing the program.
Summary
In this chapter, we learned how a C program is converted into an executable file, the structure of ELF, memory segments, and the basics of using a debugger through a Hello World program. We saw that many components such as the compiler, linker, and CPU are working behind the scenes. I cannot fully explain all the details of each mechanism here, but as this blog series progresses, these details will gradually become clearer.